
教材:<파이썬 러닝 완벽 가이드> 위키 북스
对应书本p264
数据集介绍和相关说明
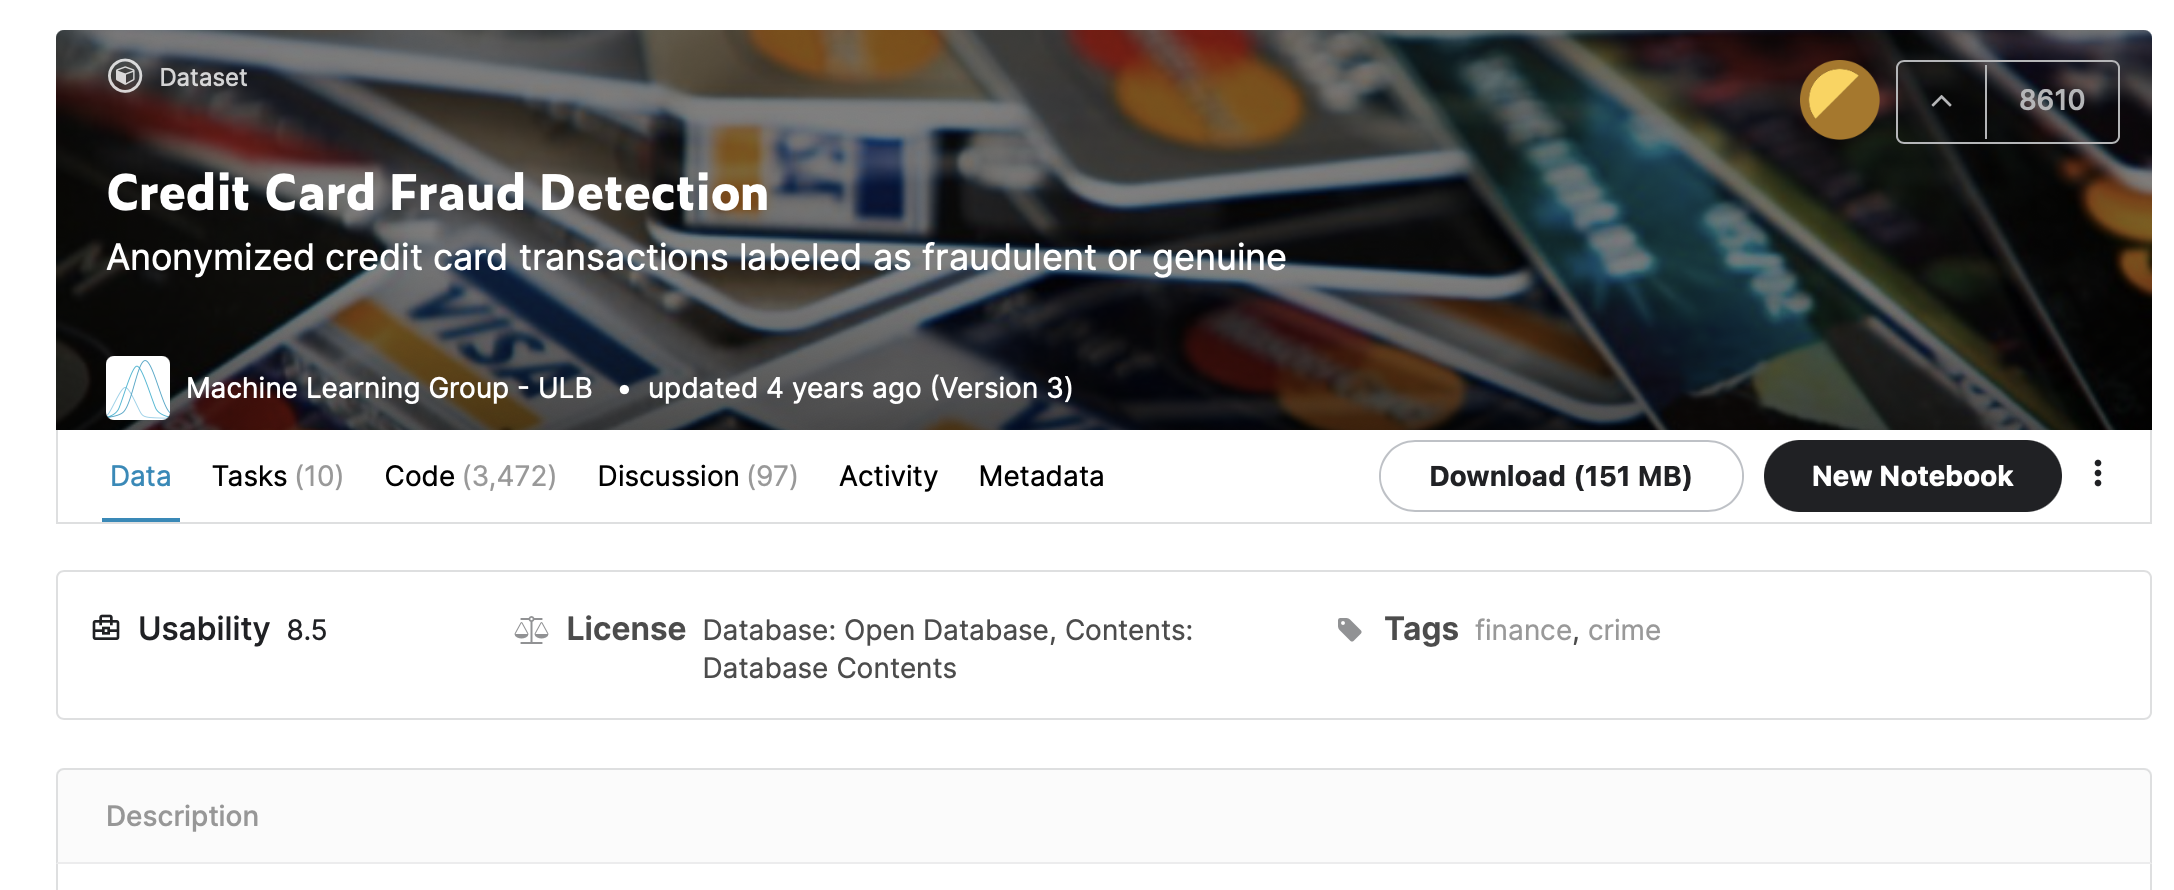
数据集地址:Credit Card Fraud Detection | Kaggle
数据集说明:
The dataset contains transactions made by credit cards in September 2013 by European cardholders.
This dataset presents transactions that occurred in two days, where we have 492 frauds out of 284,807 transactions. The dataset is highly unbalanced, the positive class (frauds) account for 0.172% of all transactions.It contains only numerical input variables which are the result of a PCA transformation. Unfortunately, due to confidentiality issues, we cannot provide the original features and more background information about the data. Features V1, V2, … V28 are the principal components obtained with PCA, the only features which have not been transformed with PCA are ‘Time’ and ‘Amount’. Feature ‘Time’ contains the seconds elapsed between each transaction and the first transaction in the dataset. The feature ‘Amount’ is the transaction Amount, this feature can be used for example-dependant cost-sensitive learning. Feature ‘Class’ is the response variable and it takes value 1 in case of fraud and 0 otherwise.
Given the class imbalance ratio, we recommend measuring the accuracy using the Area Under the Precision-Recall Curve (AUPRC). Confusion matrix accuracy is not meaningful for unbalanced classification.
数据集来源于2013年9月的欧洲信用卡用户消费记录,在284,807条消费记录中,存在492条欺诈消费,占比为0172%。该数据集不均衡性极强。
Class中,1代表诈骗消费记录,0为其他种类。
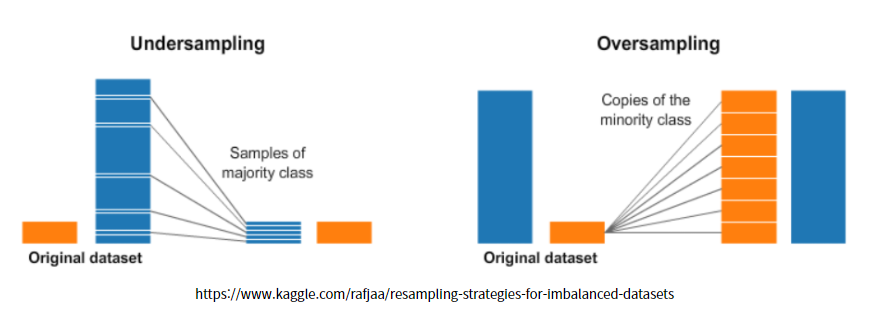
过采样oversampling与欠采样undersampling的概念
贴两个整理的比较清晰的文档:
Hwi’s ML doc 언더 샘플링(Undersampling)과 오버 샘플링(Oversampling)
数据检查和加工
数据检查
首先将下载好的creditcard.csv文件放在工程文件根目录下。
打开jupyternotebook,先导入一下依赖库:
1 | import numpy as np |
安装好依赖库之后,我们用pandas的read_csv()函数导入数据文件。
1 | card_df = pd.read_csv('./creditcard.csv') ## 读取文件 |

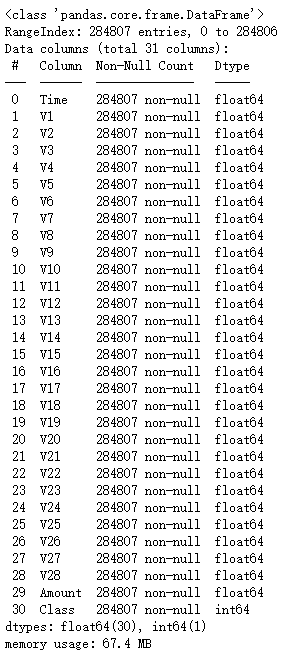
运行后可以看到已经成功读取到了数据文件。接下来根据数据文件的特征来对数据进行简单的处理。
从第二张图中我们可以看到,这个数据集中一共有284807条数据,除了Class为int整形字符类型以外,其他均为float浮点型。
根据官方的说明文档,数据文件中,Time是生成数据文件时用到的特征,没有太多的实际意义,可以去掉。以V开头的所有特征意义不明,可以去掉。Amount代表了单笔消费的金额,Class代表了最关键的分类,0代表正常消费,1代表欺诈消费。
对于高度倾斜的数据,常会用到imbalanced-learn包来进行数据的集中。
1 | pip install -U imbalanced-learn |
1 | conda install -c conda-forge imbalanced-learn |
数据处理
接下来就让我们开始着手整理一下这个数据吧。
这里使用到的是sklearn中的 train_test_split()函数。
1 | from sklearn.model_selection import train_test_split |
明确一下目标,我们要做的事情有:
 1. 删除不需要的数据
 2. 将原始数据均分为两个部分,一个是训练集,一个是测试集。
那么首先第一步,删掉我们用不到的Time特征。先定义一个函数get_preprocessed_df(),将我们读取的数据文件中Time特征删掉,并生成一组处理过的新数据df_copy。
这里用到两个函数(点击可跳转官方文档):
pandas.DataFrame.copy 复制对应的数据
pandas.DataFrame.drop 去掉指定的label
1 | DataFrame.drop(labels=None, axis=0, index=None, columns=None, level=None, inplace=False, errors='raise') |
1 | def get_preprocessed_df(df=None): |
接下来定义一个get_train_test_dataset(),将我们新生成的数据中30%设置为测试集,余下设置为训练集。要求这两个训练集的Class这个label比例相同。
这里要用到的函数:
pandas.DataFrame.iloc 通过索引行号提取数据 (通过列号提取数据为loc函数)
1 | def get_train_test_dataset(df=None): |
处理完数据之后,检查一下最终处理的结果是否符合我们的要求:
1 | print('训练集label比例') |
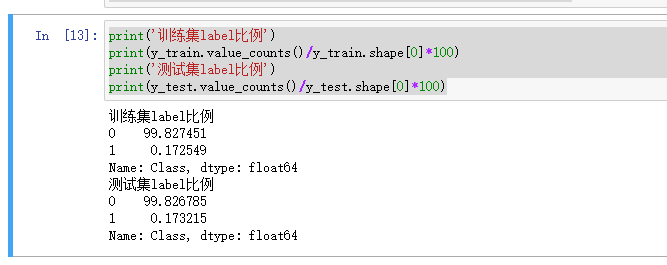
可以看到训练集和测试集中,label为1的数据占比都在0.17左右,符合要求。
模型建立
1 | from sklearn.linear_model import LogisticRegression |